 Caleb and I were in the lobby of his dance studio and he started jumping up and down – not for dance but because he has just received an email announcing his acceptance to the Global Leadership program to which he applied. Up until that moment, I was pretty certain I had nothing to worry about, expecting he would not be awarded the scholarship. Not that I don’t have confidence is his abilities, I just assumed it was a competitive program (which it was) and a long shot (apparently not).
As Caleb is celebrating, I really want to be happy for him, but I’m overwhelmed with dread. I’m responsible for Caleb’s care overnight. I prioritize his need to sleep as a growing young man, and take any measures necessary to keep him safe with as little disturbance to his rest as possible. He’s been on sleepovers and overnight field trips, and although he’s gotten through them, they’ve been complicated. We were just in Italy for a family trip last summer and with irregular eating patterns, carb intense meals, and walking seven miles a day, diabetes management worked out reasonably well, but took a lot of extra attention, creative extended boluses, temp basals, and corrections overnight to keep him safe. All of which I did.
Caleb knows what to do in the waking hours of the day, and if he has any questions, I’m usually accessible to trouble-shoot, but overnights and vacations are my responsibility. He’s fourteen – vacation should be a vacation, not extra work and stress. He’s not immune to the anxiety that the variables of traveling bring, I just do my best to soften the burden as much as possible.
I couldn’t grasp how we were going to get him prepared to do it all within the next five months. All I could think of were the overnights – him exhausted after a long, active day, with carbohydrates releasing into his bloodstream willy nilly, an artificial process crudely, manually, and non-scientifically slapping insulin at him, with aftereffects of varying levels of activity unpredictably lowering his blood sugar – to me, it was somewhat horrifying.
I heard it over and over again – “He’ll be fine!” Yes, he’s a bright young man and very responsible about his diabetes – he’s never forgotten to bolus for a meal, for example – but that isn’t useful when you’re in a deep sleep, unresponsive to alarms blaring directly into your ear, and your blood sugar is 70 with a rapid drop alarm. I know the term “dead in bed,” and I can’t ignore it.
My goal for Caleb’s blood sugar on this trip was not optimal care. My goal was no need for emergency intervention: no severe hypoglycemia resulting in unconsciousness and no hypoglycemia resulting in vomiting. Okay, something a little tighter than that, but really, if that’s what it ended up being, it would have been fine. I just wanted Caleb to be safe.
We decided to try Loop because overwhelmingly what I read about a hybrid closed loop system was the safety and assurance it provided overnight and how users were able to sleep like never before.
Simplistically, this is what Loop does:
An app on Caleb’s phone performs a bit of magic. It communicates with his pump through a little computer (see the pic above) via bluetooth. The app connects with Dexcom, assesses his current blood sugar level, the direction of his blood sugar, the amount of carbohydrates he has on board and the amount of insulin he has on board predicts what his future blood sugar will be. Based upon those predictions and the defined target bg range, the Loop app will calculate a need for insulin dosing, either higher, lower or the same and change Caleb’s basal insulin to administer any adjustments. This evaluation is done every five minutes, and his basal is adjusted every five minutes. Caleb does nothing while the app, dexcom and his pump do the work.
If Loop predicts a low blood sugar three or four hours in the future, basal will be reduced or shut off. If Loop predicts a high blood sugar, basal is raised.
We’ve managed Caleb’s blood sugar manually in a similar, albeit much broader way – played with basal to address rising and dropping bgs that weren’t what we expected. We’ve used SuperBolus techniques, again, using basal to deal with the peaks and valleys of certain foods, like breakfast cereal. But what we’ve achieved manually doesn’t compare to what is attained by recalculating future bg and adjusting dosing every five minutes. My hope was that Loop could be the watchdog over Caleb while he slept, when I couldn’t be there, softening out the Dexcom line and keeping him safe.


 It’s been more than ten years since Caleb began pumping. That’s more than 1,500 Pods, roughly estimating.

 Animas is discontinuing production and sale of its insulin pumps. Current customers
 Previously available in Europe and Canada, the Freestyle Libre Flash Glucose Monitoring System was approved by the FDA last week.
 Novo Nordisk released news last week that its faster-acting fast-acting insulin has been approved by the FDA. No need for US citizens to cross the border to Canada to get it anymore!
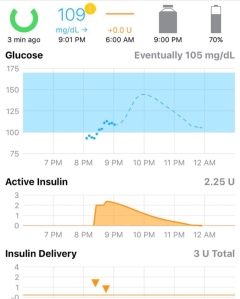 I wasted no time from